Contents:
Main (Abstract)
Introduction
Methods
Results Part I: Verification that Albedo Increases Resulted from New Reflective Roofs
Results Part II: Identification of Building Characteristics Producing Large Albedo Increases
Discussion
References
Results Part II: Identification of Building Characteristics Producing Large Albedo Increases
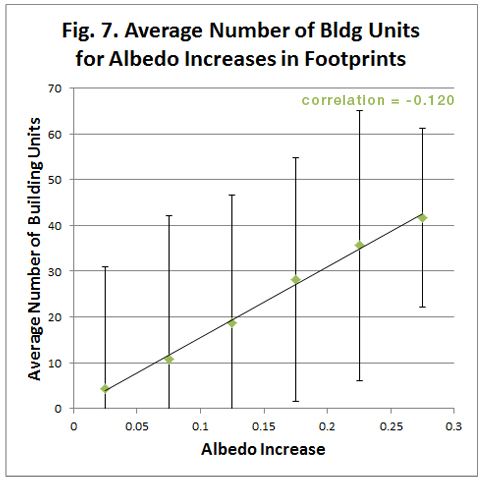
With the established premise that the temperature-decreasing albedo changes in Chicago between 1995 and 2009 resulted primarily from new reflective roofs, one can now begin to identify building criteria that produced the largest albedo increase using data in the building shape file. Specifically, this study will look at the intensity of albedo increase in relation to building height (in stories) and the number of units in the buildings (for residential buildings only). Figure 6 below shows the average building height for intervals of albedo increase and Figure 7 shows the average number of building units for these same albedo intervals. Error bars indicate one standard deviation from the mean.
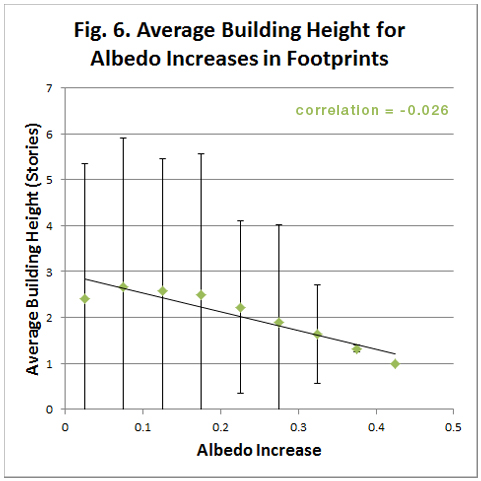
From Figure 6, it is apparent that building height tends to decrease slightly from about 2.5 stories to 1 story as the increase in albedo intensifies. However, the standard deviations on this graph are so large (evidenced by the error bars), that it is impossible to statistically conclude that there is a relationship between the two variables. This is supported by the weak correlation of -0.026 obtained using a scatter plot Figure 6’s data before it was binned into albedo intervals.
In Figure 7, a trend for the average number of building units to rise with the intensity of albedo increase is apparent. The smallest albedo increases occurred in buildings with a relatively small number of units (around 5), while the largest albedo increases occurred in residential structures of around 40 units. Like Figure 6, the standard deviation of Figure 7 is large. Hhowever, in this new graph, the relationship between building units and albedo increase seems just strong enough to overcome the error and merit some type of relationship, albeit a weak one. At the very least, one can say that the correlation of 0.120 is non-zero and indicates some form of a trend.
Continue to Next Section: Discussion